
Outlier Detection methods in Machine Learning
Objective
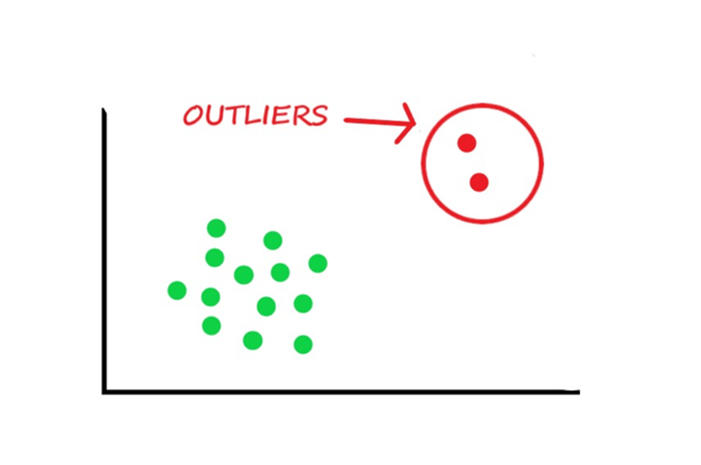
- An outlier is an individual point of data that is distant from other points in the dataset.
- It is an anomaly in the dataset that may be caused by a range of errors in capturing, processing or manipulating data.
- Outliers in the data may cause problem during model fitting as it may inflate the error metrics which give higher weights to large errors (example, mean squared error, RMSE).
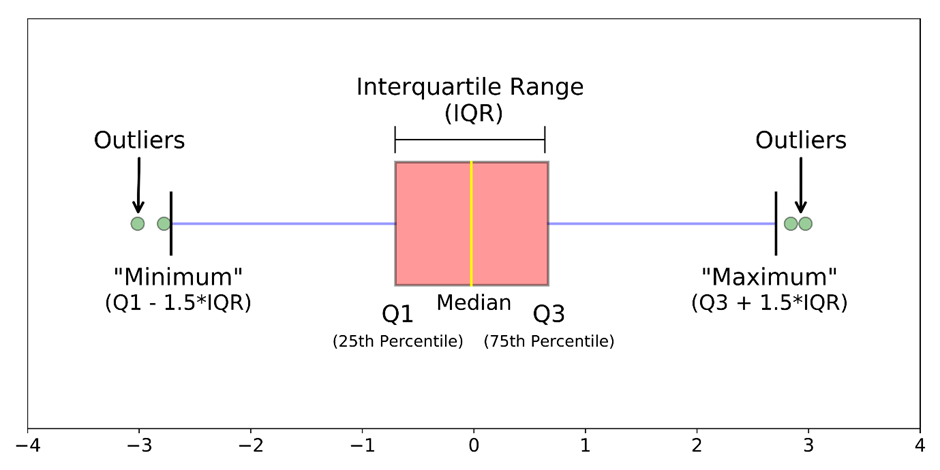
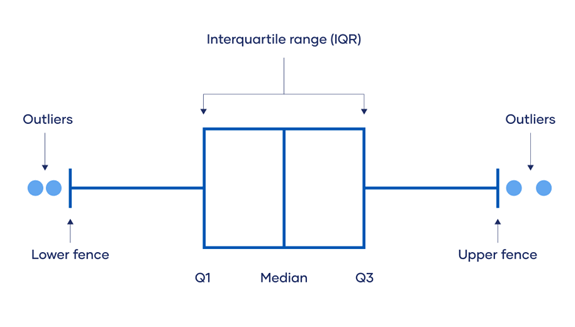
Box Plots
- Box plots are a visual method to identify outliers. Box plots is one of the many ways to visualize data distribution.
- Box plot plots the q1 (25th percentile), q2 (50th percentile of median) and q3 (75th percentile) of the data along with (q1 – 1.5 * (q3 – q1)) and (q3 + 1.5 * (q3 – q1)).
IQR method
- IQR stands for interquartile range, which is the difference between q3 (75th percentile) and q1 (25th percentile).
- IQR method is used by box plot to highlight outliers. The IQR method computes lower bound and upper bound to identify outliers.
- Lower Bound = q1 – 1.5 * IQR
- Upper Bound = q3 + 1.5 * IQR
- Any value below the lower bound and above the upper bound are considered to be outliers.
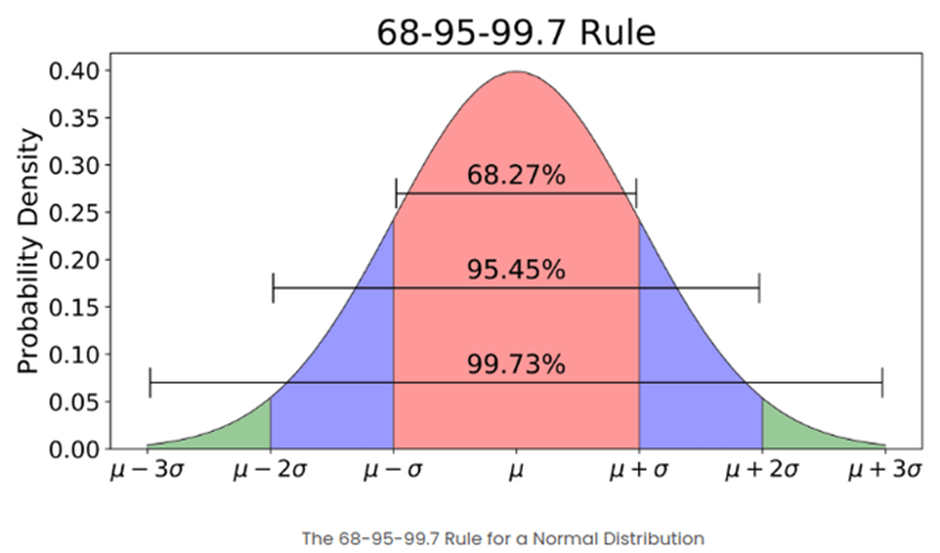
Z-Score
- Z-Score (also called as standard score) assumes a Gaussian distribution of the data. The outliers are the data points that are in the tails of the distribution and therefore far from the mean.
- By applying Z-transformation we shift the distribution and make it 0 mean with unit standard deviation. For example, Z-Score of 2 would mean the data point in 2 standard deviations away from the mean.
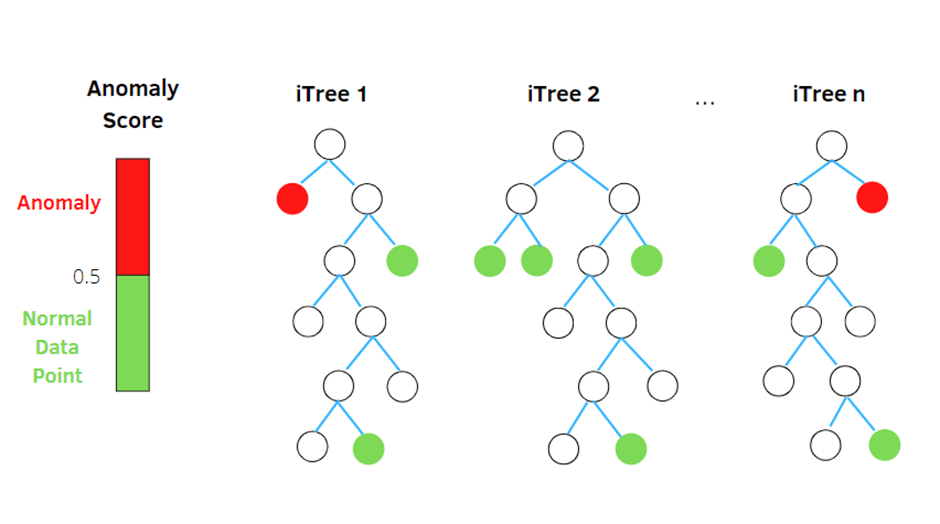
Isolation Forest
- Isolation Forest is the built based on ensemble method which identifies anomalies as the observations with short average path length on the isolation trees.
- Each isolation tree is created using the following steps:
- Randomly sample N instances from your training dataset at each node.
- Randomly choose a feature to split upon.
- Randomly choose a split value from a uniform distribution spanning from the minimum value to the maximum value of the feature chosen in the Step 2.
Step 2 and 3 are repeated recursively until, in principal, all N instances from your sample are “isolated” in leaf nodes of your isolation tree-one training instance per leaf node.
Popular Posts
Author

Spread the knowledge